From Contoso Retail to a Reproducible Helical Insight Dashboard
A verified Oracle-to-Helical walkthrough: read-only JDBC mTLS, a constrained metadata model, a ranked report, and a dashboard checked against an independent gold ledger.

Editorial disclosure. This is the second post in an independent, hands-on evaluation of Helical Insight. The project’s founder contacted me after I discovered the product, but this series is neither sponsored nor subject to editorial approval. Product documentation is cited where relevant; the results below are observations from my own controlled environment.
A dashboard is easy to make look plausible. The harder question is whether every number can be traced to a stable definition, a known source, and an independently verified result.
That distinction guided this second Helical Insight experiment. Instead of loading a toy dataset into the platform’s internal PostgreSQL database, I used an existing Contoso Retail benchmark already validated in Oracle Autonomous AI Database. Helical Insight connected to Oracle over JDBC with mutual TLS (mTLS), using a dedicated read-only account. PostgreSQL remained an internal Helical service for metadata and scheduling; it did not become a copy of Contoso.
The outcome was deliberately narrow: one query, one report, and one dashboard. But it was enough to test a complete path:
flowchart TD
    A[Independent Contoso provenance] --> B[Oracle Autonomous AI Database]
    B -->|JDBC Thin + mTLS wallet + read-only account| C[Helical Data Source]
    C --> D[Metadata + Query View]
    D --> E[Ranked report]
    E --> F[Private dashboard]
    F --> G[Comparison with an independent gold ledger]

    classDef source fill:#172554,stroke:#38bdf8,color:#fff;
    classDef platform fill:#0f766e,stroke:#5eead4,color:#fff;
    classDef evidence fill:#7c2d12,stroke:#fbbf24,color:#fff;
    class A,B source;
    class C,D,E,F platform;
    class G evidence;
The result was not a generic dashboard tour. It was a reproducible control: the top five online-sales brands by net sales for each calendar year from 2007 through 2009.
The control question was fixed before configuring the report:
What are the top five online-sales brands by net sales in each calendar year from 2007 through 2009?
I assigned it the stable identifier CT-OR-001. Its expected grain was calendar year × brand, with exactly five ranked rows per year. Net sales were defined as:
SALESAMOUNT − RETURNAMOUNT − DISCOUNTAMOUNTNet units were defined as:
SALESQUANTITY − RETURNQUANTITYThe benchmark package contains 25 Contoso tables and 34,326,191 validated rows. For this control, I limited the reporting model to three tables:
FACTONLINESALESDIMDATEDIMPRODUCT
That small scope mattered. It reduced the number of possible joins, made the report inspectable, and kept the first test tied directly to one gold query rather than a broad, unaudited semantic model.
I did not move Contoso into Helical’s PostgreSQL service. The platform’s PostgreSQL instance continues to hold only its own metadata, repository, and scheduling state. The business data stays in Oracle.
Before opening Helical, I recorded a source manifest and generated a gold ledger directly in Oracle. The ledger includes the question ID, SQL, expected grain, row count, result rows, and numeric tolerances. For CT-OR-001, the tolerance was an absolute 0.01 and a relative 0.00000001.
This is important because a dashboard is not a numerical oracle. A successful visualization proves that a tool can render a result; it does not prove that its joins, filters, measures, or ranking are correct.
Oracle documents JDBC Thin wallet connections using a TNS alias plus TNS_ADMIN; the wallet directory supplies the connection files and mTLS material.[1] I followed that pattern, but treated the wallet as a secret-bearing runtime mount rather than application content.
The operational rules were simple:
- the wallet was mounted read-only into the Helical runtime;
- its contents were excluded from Git, screenshots, public Compose examples, and Coolify variables; a sanitized Compose example can represent only the private host-directory placeholder used for its read-only bind mount;
- Oracle JDBC support JARs were made available without mounting over Tomcat’s own library directory;
- the Helical connection used a dedicated database account,
HELICAL_RO, notADMINand not Helical’s internal PostgreSQL account; HELICAL_ROreceivedCREATE SESSIONandSELECTgrants only on the 25 Contoso tables.
A direct validation confirmed a successful login and SELECT against ADMIN.DIMPRODUCT; an attempted write was denied. This is not a substitute for broader Oracle security design, but it is a useful minimum boundary for a BI read path.
The first real connection test inside Helical succeeded. That was the first gate: it demonstrated that the application could reach Oracle through JDBC mTLS, not merely that JDBC JARs had been copied into a container.
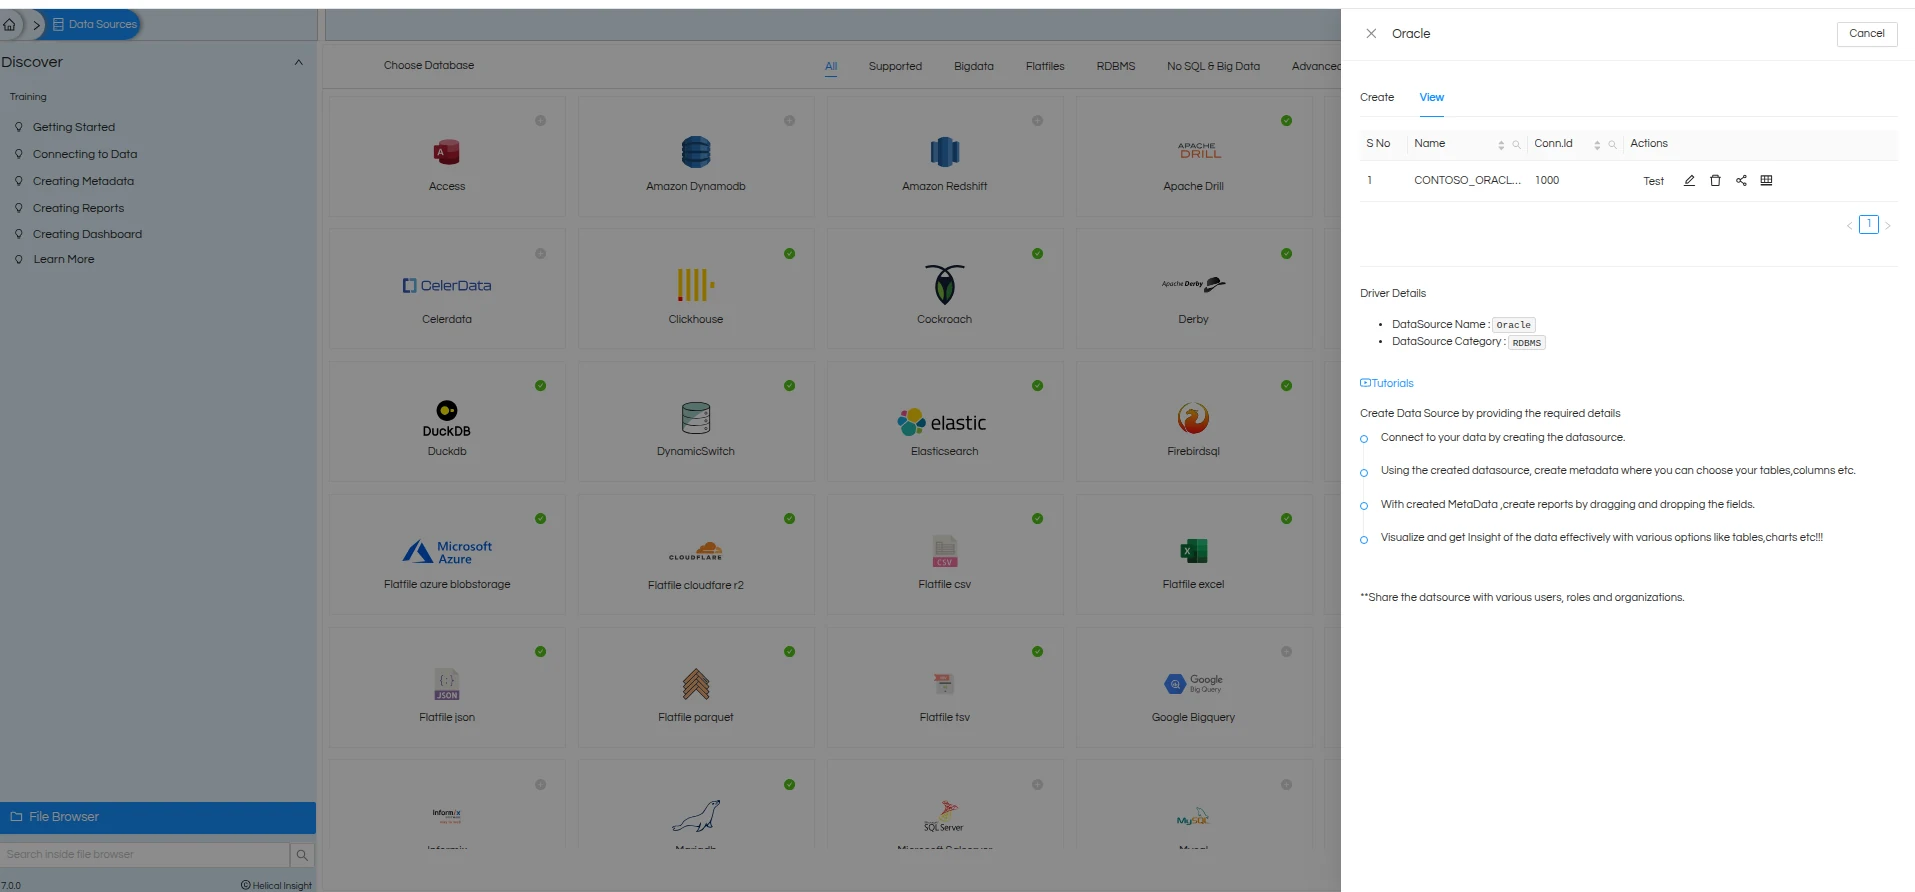
Figure 1. The persisted Oracle Data Source inside Helical. This confirms that Helical retained a configured Oracle connection; it does not, by itself, validate the report logic or its numerical output.
The first Metadata object was saved as CONTOSO_ONLINE_SALES_V1. It contains only the source tables needed for CT-OR-001 and two explicit inner joins:
FACTONLINESALES.DATEKEY = DIMDATE.DATEKEYFACTONLINESALES.PRODUCTKEY = DIMPRODUCT.PRODUCTKEYI intentionally did not add the other 22 tables. A large catalog can look impressive while making the first validation harder. The point was to establish a verified path from a physical source to a report, not to pretend that three tables constitute a complete enterprise semantic layer.
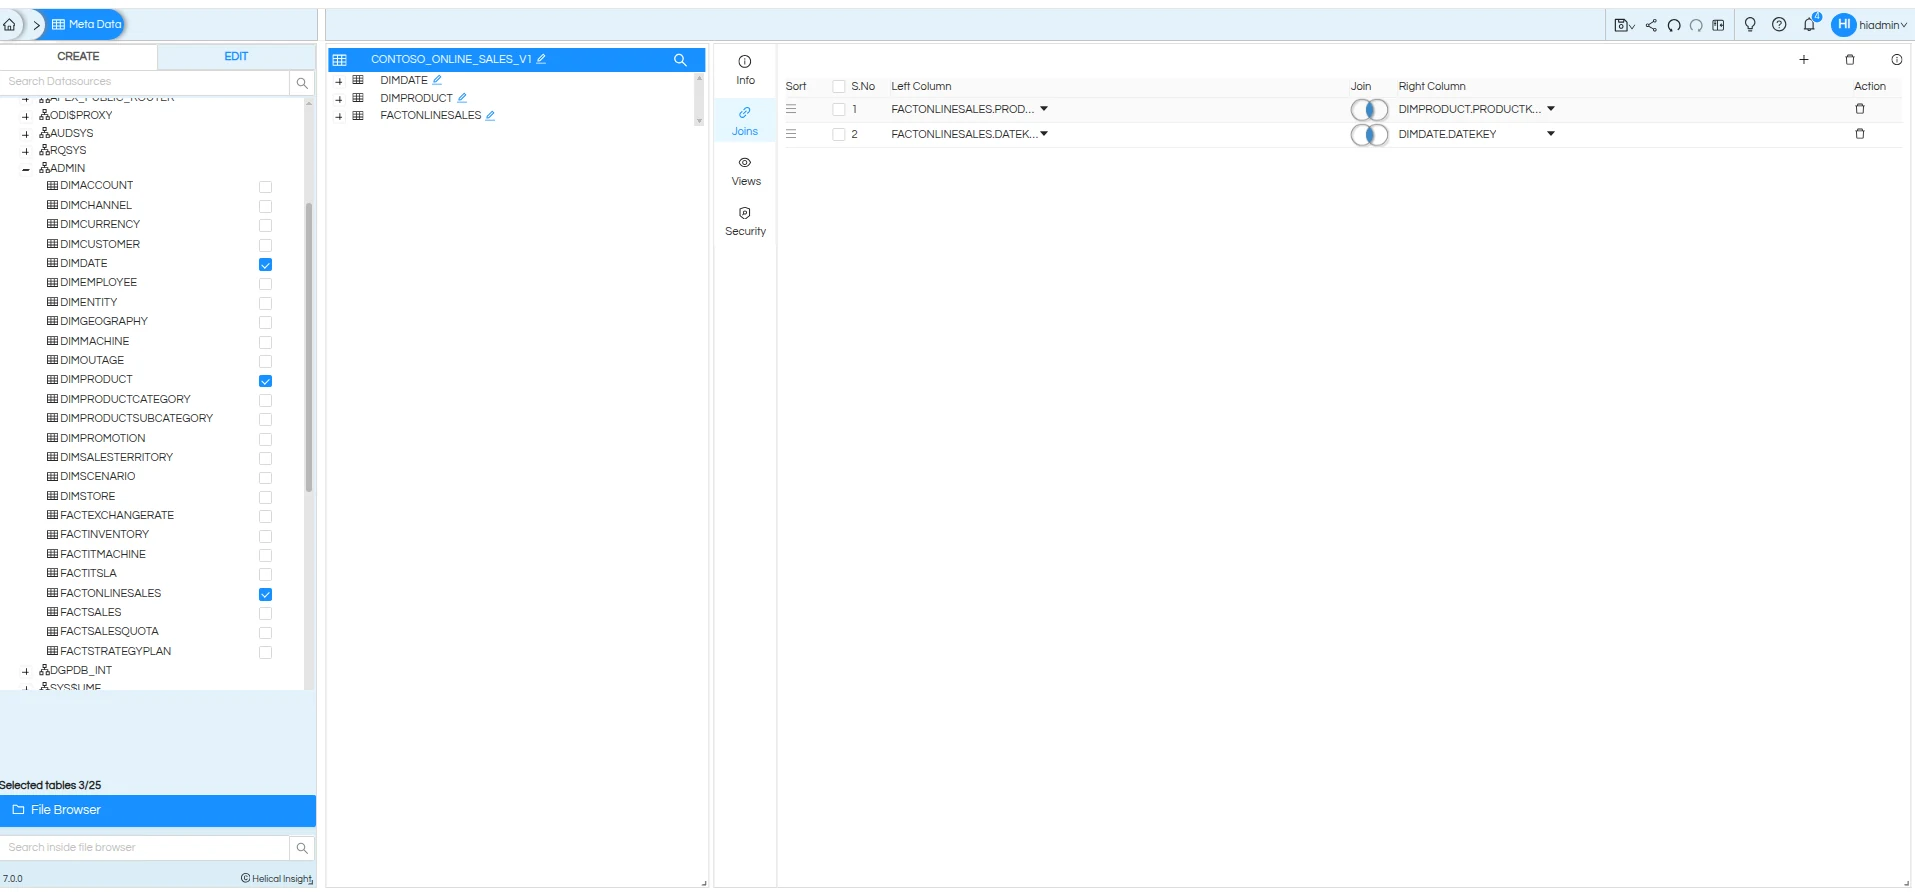
Figure 2. The deliberately constrained Metadata object: DIMDATE, DIMPRODUCT, and FACTONLINESALES, joined only through date and product keys. The screen documents the selected modeling scope; the independent Oracle ledger remains the source of numerical truth.
Helical’s documentation describes Metadata Views as virtual tables based on native SQL. They can be useful when a report is too complex for a drag-and-drop configuration alone, while also carrying a performance warning: a normal Query View becomes a subquery for reports built on it.[2] That description matched the issue I encountered next.
I first built an Ad Hoc table with CALENDARYEAR, BRANDNAME, net sales, and net units. Helical’s Ad Hoc workflow supports selecting Metadata fields, adding custom columns, and generating a report from the browser.[3]
The smoke test revealed two practical risks.
CALENDARYEAR initially appeared as a sum instead of a grouping dimension. The corrected configuration was:
CALENDARYEAR → Group byBRANDNAME → Group bynet_sales → Sumnet_units → SumA report can execute with the wrong aggregation and still appear credible. I would not rely on a blue UI state or an open context menu as evidence that a configuration change took effect; the resulting field chips and generated output need review.
The first net-sales expression returned Oracle BINARY_DOUBLE. Helical’s result materialization failed with Invalid SQL type for column even though the SQL arithmetic was valid in Oracle.
Casting every row to NUMBER(38,2) made the report run, but it introduced a more subtle problem: rounding millions of source rows before aggregation shifted some totals. The correct repair was to retain the source arithmetic’s available precision while converting the expression to Oracle NUMBER before Helical materialized it:
CAST( FACTONLINESALES.SALESAMOUNT - FACTONLINESALES.RETURNAMOUNT - FACTONLINESALES.DISCOUNTAMOUNT AS NUMBER)That is a useful lesson beyond this product: an apparent type-compatibility fix can change business arithmetic if it changes when rounding happens.
The Ad Hoc table was therefore retained as a transport and aggregation smoke test, not as the final control. Its pagination still contained brands outside the top five, which meant it had not implemented the required ranking within each year.
The final logic lived in the private Query View CT_OR_001_TOP5_BY_YEAR_V1. It groups online sales by year and normalized brand, ranks each year separately, and returns the first five rows per partition.
WITH sales_by_brand AS ( SELECT d."CALENDARYEAR" AS calendar_year, RTRIM(p."BRANDNAME") AS brand_name, SUM(CAST( f."SALESAMOUNT" - f."RETURNAMOUNT" - f."DISCOUNTAMOUNT" AS NUMBER )) AS net_sales, SUM( f."SALESQUANTITY" - f."RETURNQUANTITY" ) AS net_units FROM ADMIN."FACTONLINESALES" f INNER JOIN ADMIN."DIMDATE" d ON d."DATEKEY" = f."DATEKEY" INNER JOIN ADMIN."DIMPRODUCT" p ON p."PRODUCTKEY" = f."PRODUCTKEY" GROUP BY d."CALENDARYEAR", RTRIM(p."BRANDNAME")),ranked AS ( SELECT calendar_year, brand_name, net_sales, net_units, ROW_NUMBER() OVER ( PARTITION BY calendar_year ORDER BY net_sales DESC ) AS rank_in_year FROM sales_by_brand)SELECT calendar_year, brand_name, CAST(ROUND(net_sales, 2) AS NUMBER(38,2)) AS net_sales, net_units, rank_in_yearFROM rankedWHERE rank_in_year <= 5 AND calendar_year IN (2007, 2008, 2009)ORDER BY calendar_year, net_sales DESC;The final filter is deliberately outside the first aggregation. During validation, moving it earlier produced a one-cent rounding edge in one result because the source calculation used floating-point values. Keeping the SQL shape aligned with the independently generated gold query produced an exact comparison while retaining JDBC-compatible result types.
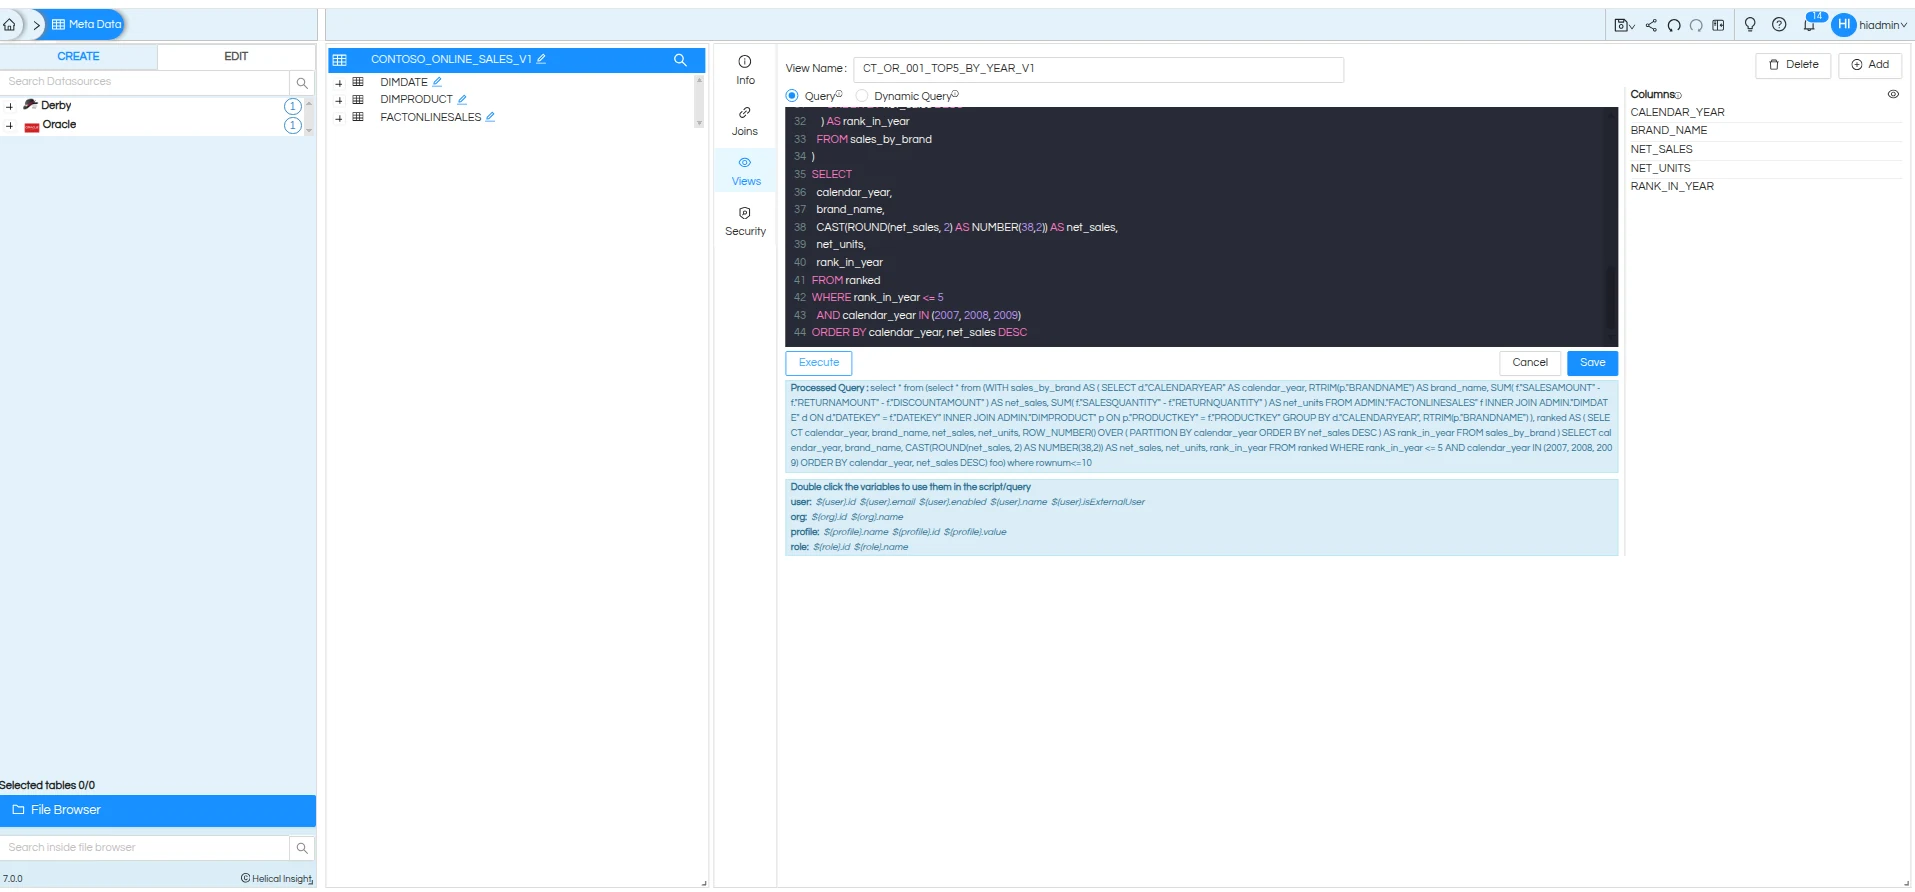
Figure 3. The Query View editor with the ranking query and its generated output fields. It demonstrates why the final control used native SQL instead of treating a drag-and-drop top-N as equivalent to a partitioned ranking. The external comparator—not this editor—is the correctness check.
The validated report was saved privately as CT_OR_001_TOP5_BY_YEAR_REPORT_V1. The dashboard was saved privately as CONTOSO_ONLINE_SALES_TOP5_DASHBOARD_V1.
The test had four acceptance conditions:
- exactly 15 output rows;
- five ranks for each of 2007, 2008, and 2009;
- brands, net sales, and net units within the declared tolerance;
- no data copy into PostgreSQL.
All four passed.
| Year | Rank 1 | Rank 2 | Rank 3 | Rank 4 | Rank 5 |
|---|---|---|---|---|---|
| 2007 | Contoso | Adventure Works | Fabrikam | A. Datum | Litware |
| 2008 | Contoso | Fabrikam | Litware | Proseware | Adventure Works |
| 2009 | Contoso | Fabrikam | Litware | Adventure Works | Proseware |
The report contained the expected 15 rows and matched the independent Oracle ledger. The dashboard did not become the source of truth; it became a rendered view of a result that had already been checked.
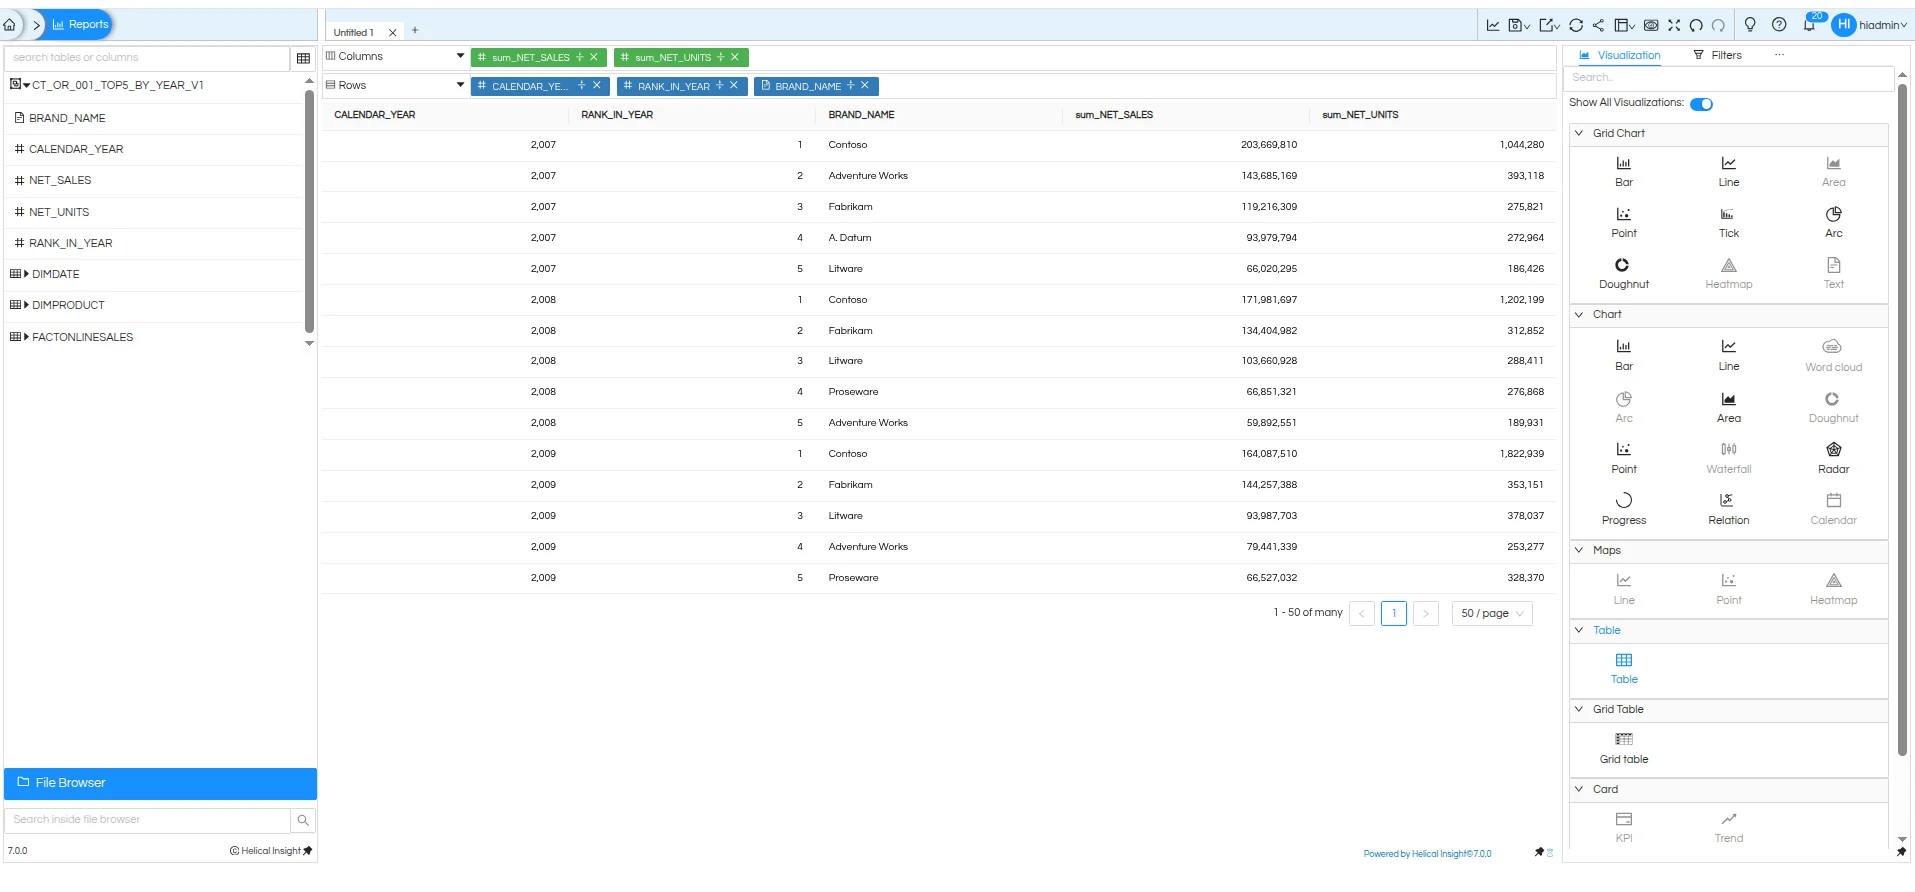
Figure 4. The final report presents all 15 ranked rows in one table. The visible rows support the execution and presentation evidence; the separate comparison against gold-results.json establishes the numeric match.
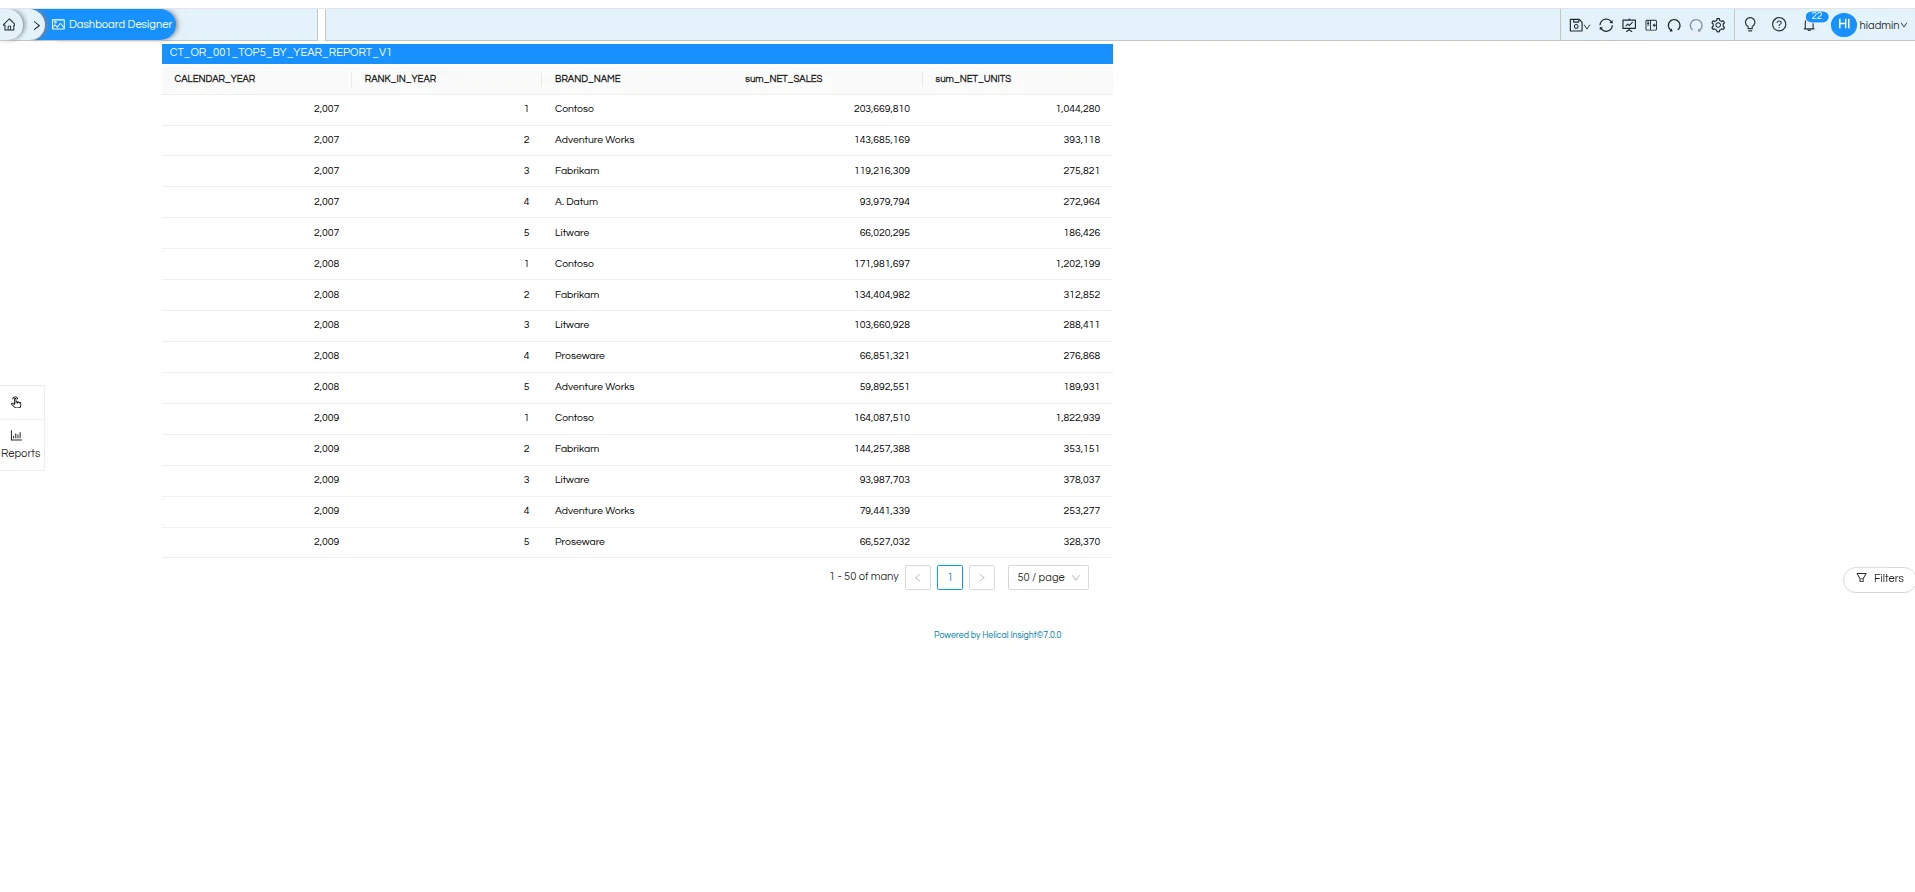
Figure 5. The dashboard renders the validated report as a single component. It is deliberately simple: the value here is traceability from source query to rendered table, not visual complexity.
This experiment demonstrates that Helical Insight v7.0 can, in this environment:
- connect to Oracle Autonomous AI Database through JDBC Thin with an mTLS wallet;
- use a dedicated read-only account rather than an administrative connection;
- model a small, explicit join path;
- use a Metadata Query View for a partitioned ranking that the basic Ad Hoc configuration did not express safely;
- persist a private report and dashboard; and
- reproduce an independently calculated Oracle control.
This Post 2 did not evaluate the Semantic Model. That was a scope decision, not a conclusion about the feature. The objective here was to prove a basic, auditable path from Oracle to a report and dashboard before introducing another modeling layer. A later test will examine Semantic View on its own terms: canonical measures, dimensions, hierarchies, business definitions, grain, and the way those choices affect answer quality.
Instant BI with a real LLM was also outside this test, as were broader production-readiness and general Query View performance claims. The workload was deliberately small and controlled.
- Oracle integration passed a real test. Helical reached Oracle through JDBC mTLS, using a dedicated read-only account, then returned a result that matched an independent ledger. That is much more useful than a driver-installation claim.
- The metadata layer was easy to constrain. Starting with three tables and two explicit joins kept the model inspectable. I could see exactly what was in scope and what was not.
- Query Views provided an escape hatch. The drag-and-drop report was good enough for a smoke test. When the requirement became “top five for each year,” the Query View gave me a place to write the exact Oracle SQL instead of forcing the UI to do something it did not express safely.
- The artifacts persisted cleanly. Metadata, reports, and the dashboard were saved as distinct private objects. The File Browser made it possible to check that the expected artifacts existed after each step.
- The platform did not force a PostgreSQL copy of the data. Keeping PostgreSQL for Helical’s internal state and Oracle as the business-data source is a clean separation for this kind of evaluation.
- The navigation needs to be less ambiguous. Reaching the actual Metadata editor took trial and error, and a “Views” path opened documentation rather than the editor I needed. Helical could reduce that friction with clear application-level links, stable deep links to saved objects, and distinct labels for documentation versus editors.
- Aggregation state needs a clearer visual contract.
CALENDARYEARinitially behaved like a measure, and clicking aggregation controls could change state in ways that were easy to misread. The report designer should show an unambiguous “dimension/group-by” or “measure/aggregate” label on every selected field and make the generated SQL easier to inspect before execution. - JDBC type failures need actionable diagnostics.
Invalid SQL type for columndid not reveal that OracleBINARY_DOUBLEwas the underlying problem. A useful error would name the result column, its JDBC type, the failing component, and a safe type-conversion hint. - Partitioned ranking should not require a SQL detour for such a common question. The basic Ad Hoc report could aggregate brands but could not safely express “top N within every year.” A ranking control with a partition field, sort field, and visible generated SQL would cover this case without hiding the logic.
- The dashboard designer is functional but sparse. A single table component was enough for this control, but the workflow feels closer to assembling an internal report than designing a polished dashboard. Better layout guidance, stronger defaults for filters and drilldowns, and a more direct report-to-dashboard flow would help.
My view after this session is positive, with reservations. Helical passed the technical test that mattered: it queried Oracle through a least-privilege mTLS connection, handled a small reporting model, preserved the reporting artifacts, and matched an external numerical control. That is real capability.
The experience also required more engineering attention than the interface suggests. I had to verify every aggregation choice, work around a JDBC type boundary, move the ranking into SQL, and treat the dashboard as presentation rather than proof. I would use Helical again for a controlled, self-hosted BI workflow where the team is willing to keep definitions explicit and validate results outside the UI. I would not treat its friendlier screens as a substitute for those controls.
[1] Oracle, “JDBC Thin Connections with a Wallet (mTLS).” https://docs.oracle.com/en/cloud/paas/autonomous-database/serverless/adbsb/connect-jdbc-thin-wallet.html
[2] Helical Insight, “Usage of ‘View’ in Ad-hoc Module.” https://www.helicalinsight.com/usage-of-views/
[3] Helical Insight, “Creating Ad-hoc Reports.” https://www.helicalinsight.com/adhoc-reports/